Global Carbon Accounts in 2021
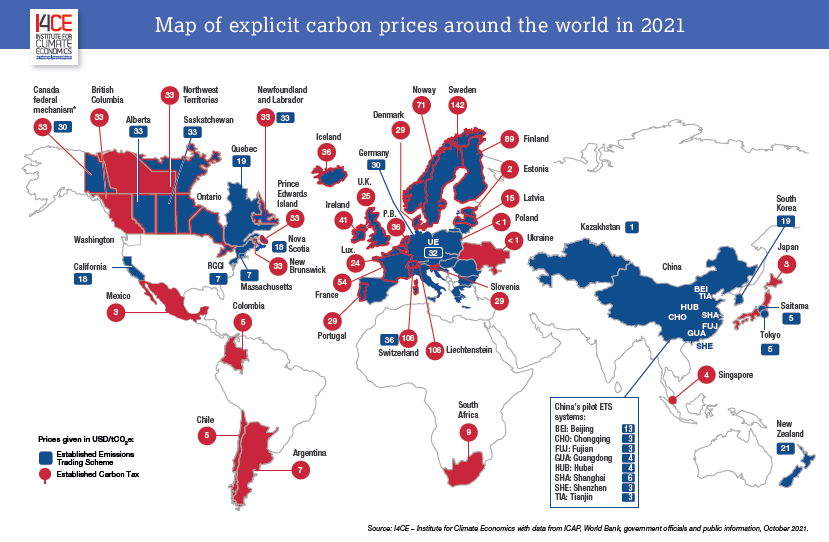
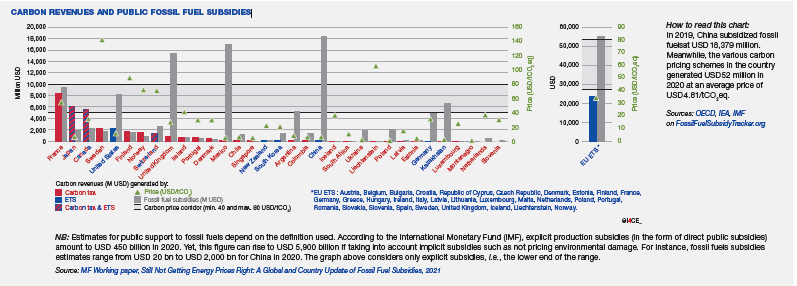
Explicit carbon pricing systems – a tax or a carbon market – continue to develop around the world. In the 2021 edition of its Global Carbon Accounts, I4CE presents the main trends and provides an overview of these public policies: the countries that have adopted them, the sectors covered, the price levels, the revenues generated and what is being done with them. Find all this information in graphics.
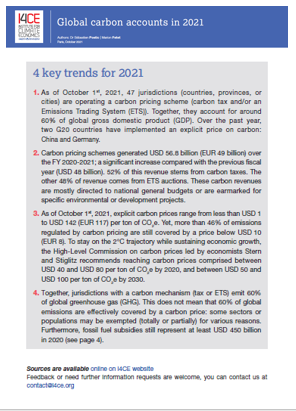
The 4 trends of 2021
- As of October 1st, 2021, 47 jurisdictions (countries, provinces, or cities) are operating a carbon pricing scheme (carbon tax and/or an Emissions Trading System (ETS)). Together, they account for around 60% of global gross domestic product (GDP). Over the past year, two G20 countries have implemented an explicit price on carbon: China and Germany.
- Carbon pricing schemes generated USD 56.8 billion (EUR 49 billion) over the FY 2020-2021; a significant increase compared with the previous fiscal year (USD 48 billion). 52% of this revenue stems from carbon taxes. The other 48% of revenue comes from ETS auctions. These carbon revenues are mostly directed to national general budgets or are earmarked for specific environmental or development projects.
- As of October 1st, 2021, explicit carbon prices range from less than USD 1 to USD 142 (EUR 117) per ton of CO2e. Yet, more than 46% of emissions regulated by carbon pricing are still covered by a price below USD 10 (EUR 8). To stay on the 2°C trajectory while sustaining economic growth, the High-Level Commission on carbon prices led by economists Stern and Stiglitz recommends reaching carbon prices comprised between USD 40 and USD 80 per ton of CO2e by 2020, and between USD 50 and USD 100 per ton of CO2e by 2030.
- Together, jurisdictions with a carbon mechanism (tax or ETS) emit 60% of global greenhouse gas (GHG). This does not mean that 60% of global emissions are effectively covered by a carbon price: some sectors or populations may be exempted (totally or partially) for various reasons.
Furthermore, fossil fuel subsidies still represent at least USD 450 billion in 2020 (see page 4).

I4CE

Principal sources and useful links:
- Download data (coverage, price and revenues) from carbon schemes
- I4CE, Carte des revenus carbone 2020, I4CE
- “Using carbon revenues”, 2019, World Bank-AFD-I4CE
- “State and Trends of Carbon Pricing 2021”, World Bank.
- Carbon pricing dashboard, World Bank
- ICAP Status report 2021
- ETS Map de ICAP
- “Effective Carbon Rates 2021: Pricing Carbon Emissions Through Taxes and Emissions Trading”, OECD
- Working paper OCDE, “The use of revenues from carbon pricing”
- Base de données PINE de l’OCDE
- WRI, « Closing the Gap: The Impact of G20 Climate Commitments on Limiting Global Temperature Rise to 1.5°C », 16 septembre 2021,
- Ministère de la transition écologique et I4CE-L’institut de l’Économie pour le climat. « Datalab – Chiffres clés du climat 2021 – France, Europe et Monde ».
- « Fossil Fuel Subsidies Tracker »
- IMF. « Still Not Getting Energy Prices Right: A Global and Country Update of Fossil Fuel Subsidies ».
- Carl, Jeremy, et David Fedor. « Tracking Global Carbon Revenues: A Survey of Carbon Taxes versus Cap-and-Trade in the Real World ». Energy Policy 96 (septembre 2016)


